[ad_1]
Data shows the Bitcoin investor sentiment has recently improved, but buyers are still reluctant as fear continues in the market.
Bitcoin Fear And Greed Index Points To A Fearful Sentiment
As per the latest weekly report from Arcane Research, the BTC market sentiment hit a high of 34 last week, but now it has once again fallen to just above extreme fear territory.
The “fear and greed” index is an indicator that measures the general sentiment among investors in the Bitcoin market.
The metric uses a numeric scale that runs from zero to hundred for representing this sentiment. All values above fifty imply greed, while those below the threshold suggest fear.
Values towards the end of the range of above 75 and below 25 signify sentiments of “extreme greed” and “extreme fear,” respectively.
Historically, tops have tended to form during extreme greed, while bottoms have taken place during the periods with the latter sentiment.
Because of this fact, some traders believe it’s best to sell while the market is extremely greedy and buy when investors are extremely fearful.
“Contrarian investing” is a trading technique that echoes this idea. The famous Warren Buffet quote sums it up: “be fearful when others are greedy, and greedy when others are fearful.”
Now, here is a chart that shows the trend in the Bitcoin fear and greed index over the past year:
The value of the indicator seems to have surged up during recent weeks | Source: Arcane Research's The Weekly Update - Week 29, 2022
As you can see in the above graph, the Bitcoin fear and greed has observed some growth recently and is currently at a value of 26, suggesting a fearful sentiment is gripping the market currently.
Preceding this latest improvement in the mentality was a long stretch of extreme fear, the longest in the history of the crypto, in fact. It lasted for 74 days.
Last week, the indicator’s value had risen up to even 34 as the coin’s price saw a recovery rally. However, as the run ended and the crypto once again slumped down, so did the sentiment among the investors.
The report notes that this trend indicates participants in the BTC (and wider crypto) market believe that this recent rally was just a fakeout.
Overall, the sentiment is certainly an improvement over the extreme fear hell of June, but the buyers still remain reluctant.
BTC Price
At the time of writing, Bitcoin’s price floats around $21.3k, down 10% in the last week. Over the past month, the crypto has gained 2% in value.
The below chart shows the trend in the price of the coin over the last five days.
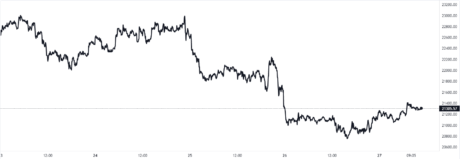
Looks like the value of the crypto has gone down over the last few days | Source: BTCUSD on TradingView
Featured image from Kanchanara on Unsplash.com, charts from TradingView.com, Arcane Research
[ad_2]
Image and article originally from www.newsbtc.com. Read the original article here.