[ad_1]
A significant IPO slowdown
Back in 2021, U.S. markets had a record year for IPOs, driven by a lot of unicorn and special purpose acquisition company (SPAC) listings. However, as interest rates rose and the market sold off in 2022, the IPO music abruptly stopped.
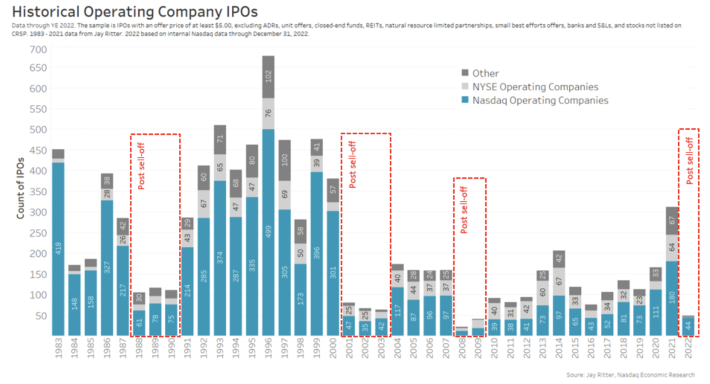
We use data from Jay Ritter because he has a longer history that takes us back to the 1980s, and for 2022, we copy his method (see the details under the chart heading). In the whole year, we recorded just 181 IPOs in U.S. equity markets, having seen more than 1,000 the year before. Just under half (47%) of those were operating companies, with the rest being new SPACs (48%) and ADRs (5%).
Chart 1: New IPOs fell significantly as the market sold off in 2022
Despite the lower number of IPOs, looking at operating companies that made it to the public markets, there were nine unicorns that listed and reached a market cap of over $1 billion on their first trading day, with the largest being TPG Inc. with a market cap of $8.08 billion.
Nasdaq was also a clear favorite for new companies looking to list – representing the new home for 92% of all new IPOs, excluding SPACs.
Interestingly, a drop in IPOs following a selloff is pretty common. The good news is that the recovery in listings typically starts as soon as valuations begin to recover. That makes this year’s rates and earnings moves important factors to watch for new-company investors.
Chart 2: New IPOs fell significantly as the market sold off in 2022
Day-one returns stayed strong
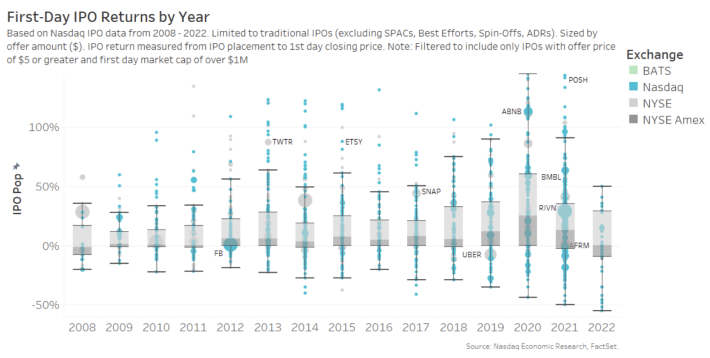
The day-one IPO return measures the return of the stock from the overnight institutional placement price to the close on the first day of trading.
Jay Ritter also shows the day-one IPO return (IPO pop) from 1980 through 2020 averaged 18.4%. In Chart 3 below, we also exclude the few IPOs with a market cap under $1 million. Our data shows that:
-
In 2020, the strong IPO market during Covid, we saw that the premium increased to 38% on average.
-
In 2021, the average pop fell to 26%. Although, we also note that a few very-popular IPOs pull up the 2021 average.
-
Last year, with fewer IPOs available, we saw day-one returns averaging a strong 44%, although the median return was much lower, under 1%. We also see that 31% of all IPOs fell on day one in 2022.
Chart 3: Distribution of IPO first-day returns
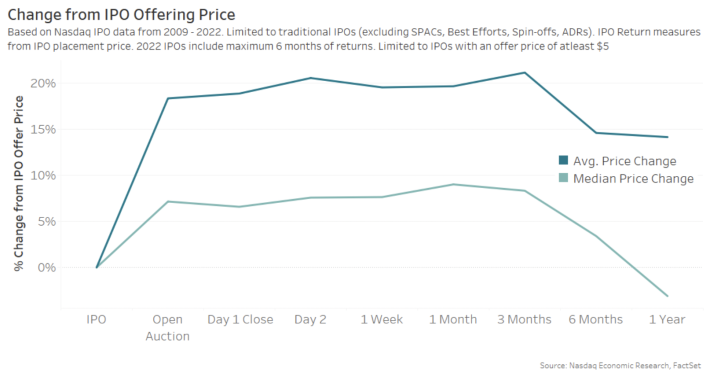
Interestingly, academic research on IPO day-one returns suggests that the majority of IPO price discovery is priced in during the pre-open period.
That means most day-one returns (and even longer) are earned between the overnight placement and the official open auction on public markets, as the data in Chart 4 also shows.
That is also important for direct listings, as it shows the opening auction is an efficient price-discovery mechanism, even with the large supply and demand that typically occurs in the first opening auction for a stock.
Chart 4: Since 2009, the opening auction typically prices in most of the day-one returns
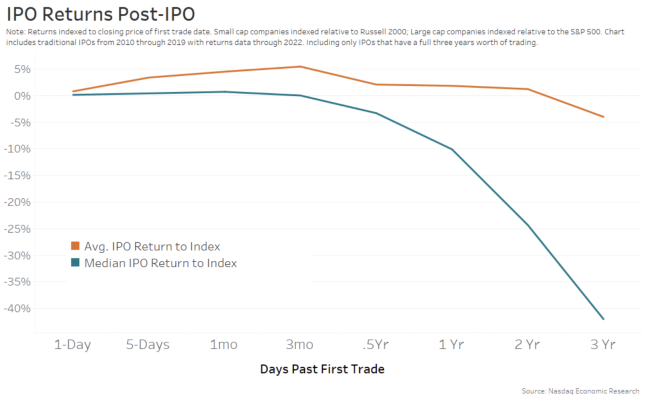
Long-term returns are for stock pickers
As IPOs are new stocks, they typically have higher growth potential but also less history of meeting targets or data on how competitors will respond to their new products.
Not surprisingly, that uncertainty on performance translates to a large divergence in over- and under-performance in the years after IPO. In fact, data shows that long-term performance eventually dwarfs day-one IPO returns. We calculate that top decile stocks outperform by 350% while the worst decile underperforms by more than 100% (as they fall close to over 90% while the broad market gains).
However, on average, over the longer term, IPOs’ outperformance tends to fall in line with the market (orange line, Chart 5). The majority of IPOs actually end up underperforming the market (blue line), but because the gains made by outperformers are much larger than the losses of the underperformers, the average is much higher than the median.
This also proves how important it is for stock pickers to analyze and understand the fundamentals and opportunities of the companies they choose to invest in.
Chart 5: Average and median long-term IPO performance
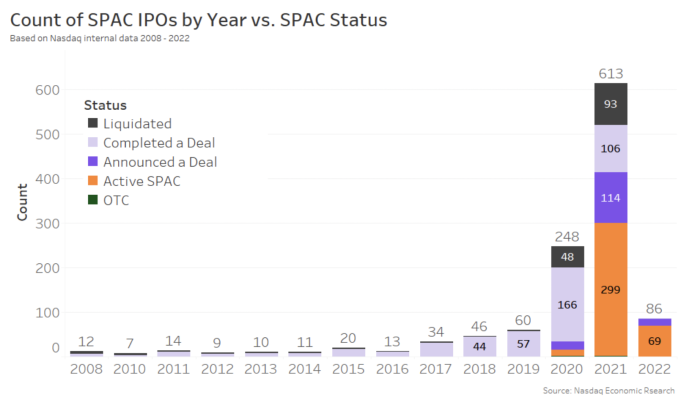
SPAC spike subsides
After a dramatic increase in SPACs during Covid, when interest rates were near zero, SPAC activity has also fallen – but not stopped. In 2022, as interest rates rose, we counted 86 new SPACs.
Changing regulations also impeded SPAC growth. Because SPACs are already listed, but the target company remains private, a lot of the IPO rules (Securities Act of 1933), as well as some trading rules (Exchange Act of 1934) and Private Equity Rules (Private Securities Litigation Reform Act of 1995), don’t work the same as for other IPOs. Consequently, new SPAC rules were proposed to make compliance more consistent – from financial statement requirements to using projections – while also clarifying that a SPAC is not an Investment Company (under the 1940 Act).
Chart 6: Count of SPACs per year
There were also concerns that SPAC liquidations would be taxed under a new federal buyback levy, although the government announced recently that that wouldn’t be the case.
Data shows that SPACs were liquidating at a record pace toward the end of the year, with roughly 85 SPACs closing in December, taking nearly $750 million in losses. For the whole year, we counted 141 of the SPACs that started since 2020 liquidated, which is still much higher than the longer-run average liquidation rate (black in Chart 6).
We also see that there are 368 SPACs from the past two years, more than half, that are still looking for a target (orange color in Chart 6). There are even a few from 2020, despite SPAC managers typically having just a two-year runway to find a deal (totaling 383).
However, data shows that 94% of SPACs from 2020, and 53% from 2021, have found targets. The average completion rate from 2008 to 2019 was 91%.
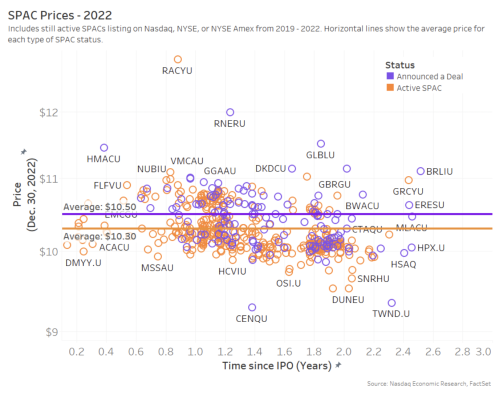
SPAC prices still spike after a deal
Despite all the difficulties with completing SPAC deals, data suggests that most stage-one SPACs (orange area from Chart 6 above) still have prices that remain close to their $10 issue price (orange dots in Chart 7) with an average of $10.30. This is as we would expect, given investors at that stage can still recall their investments ahead of a deal closing.
In fact, despite a lot of the concerns about SPAC prices falling after overpaying for targets, the data suggests otherwise. Average prices for SPACs with deals announced are even higher, at $10.50 (purple area in Chart 6 and purple dots in Chart 7).
Chart 7: Most SPAC prices have not fallen as much as many believe
Looking forward to 2023
With interest rates expected to stabilize this year, valuations could also recover. Especially if, as many expect, we have a relatively small slowdown with a quick return to growth.
The need for private companies to access public finances in order to grow while reducing their costs of capital remain. We join many other investors looking forward to the pipeline of IPOs restarting.
[ad_2]
Image and article originally from www.nasdaq.com. Read the original article here.